
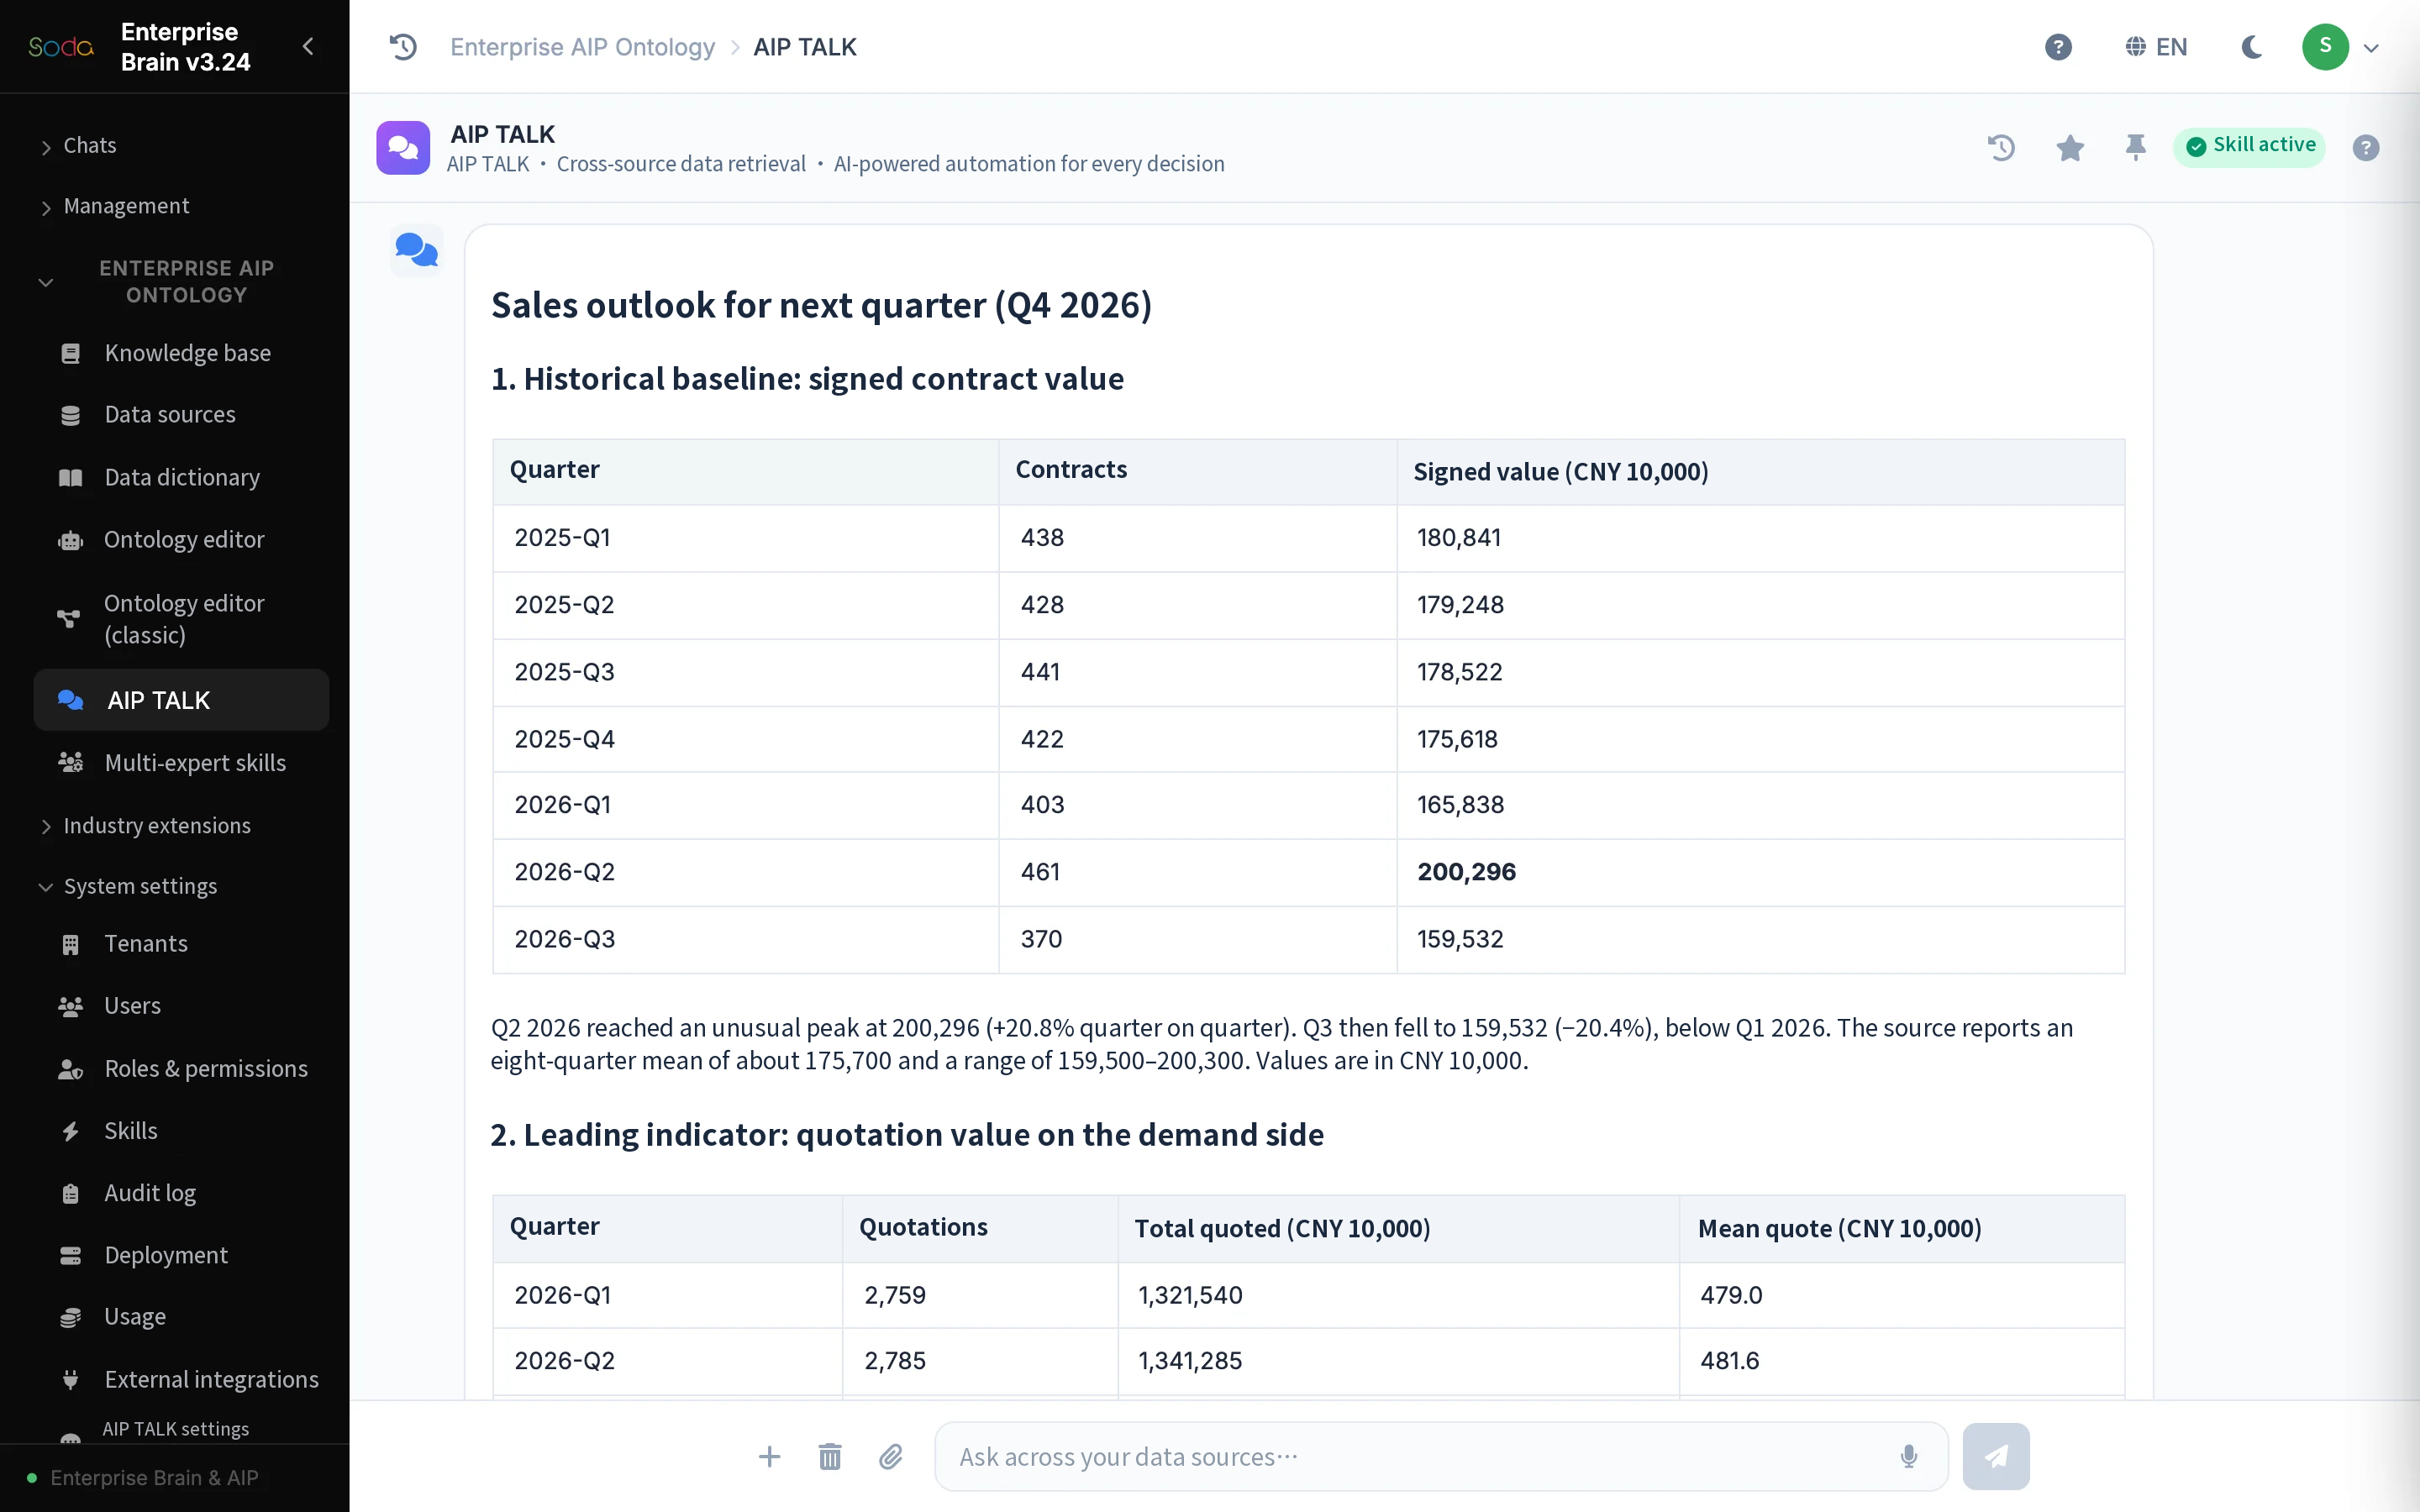
Turn an open-ended question into one you can analyze
“How are sales doing?” can become a comparison of order value for a specific region and period against the preceding comparable period. Clear dates, entities and metrics make the answer easier to check. The interactive demonstration uses synthetic data so you can try different questions.
- Start with the total. How do this month’s sales break down by product line?
- Look at the change. Which products differ most from the previous period?
- Check the definition. Does this metric include refunds or incomplete orders?
Keep the context visible as you ask follow-ups
An analysis rarely ends with one question. Carry confirmed conditions into each follow-up, and say when the period, entity or source changes. Readers can then tell whether a different conclusion reflects a change in the business or in the scope of the query.
Find the next step when data is missing
If the current customer system has no inventory records, the answer should identify the gap and the inventory or production data needed to fill it. This helps the user complete the question and avoids treating a missing record as zero stock.
Check the figures behind the chart
After reviewing a trend, inspect the source, field definitions and calculation rules. For consequential decisions, compare the figures with a reference report and record any discrepancy and its cause. These checks help teams move from a demonstration to regular use.