
“Generate the H1 2026 operating report.” Build an overview across five areas
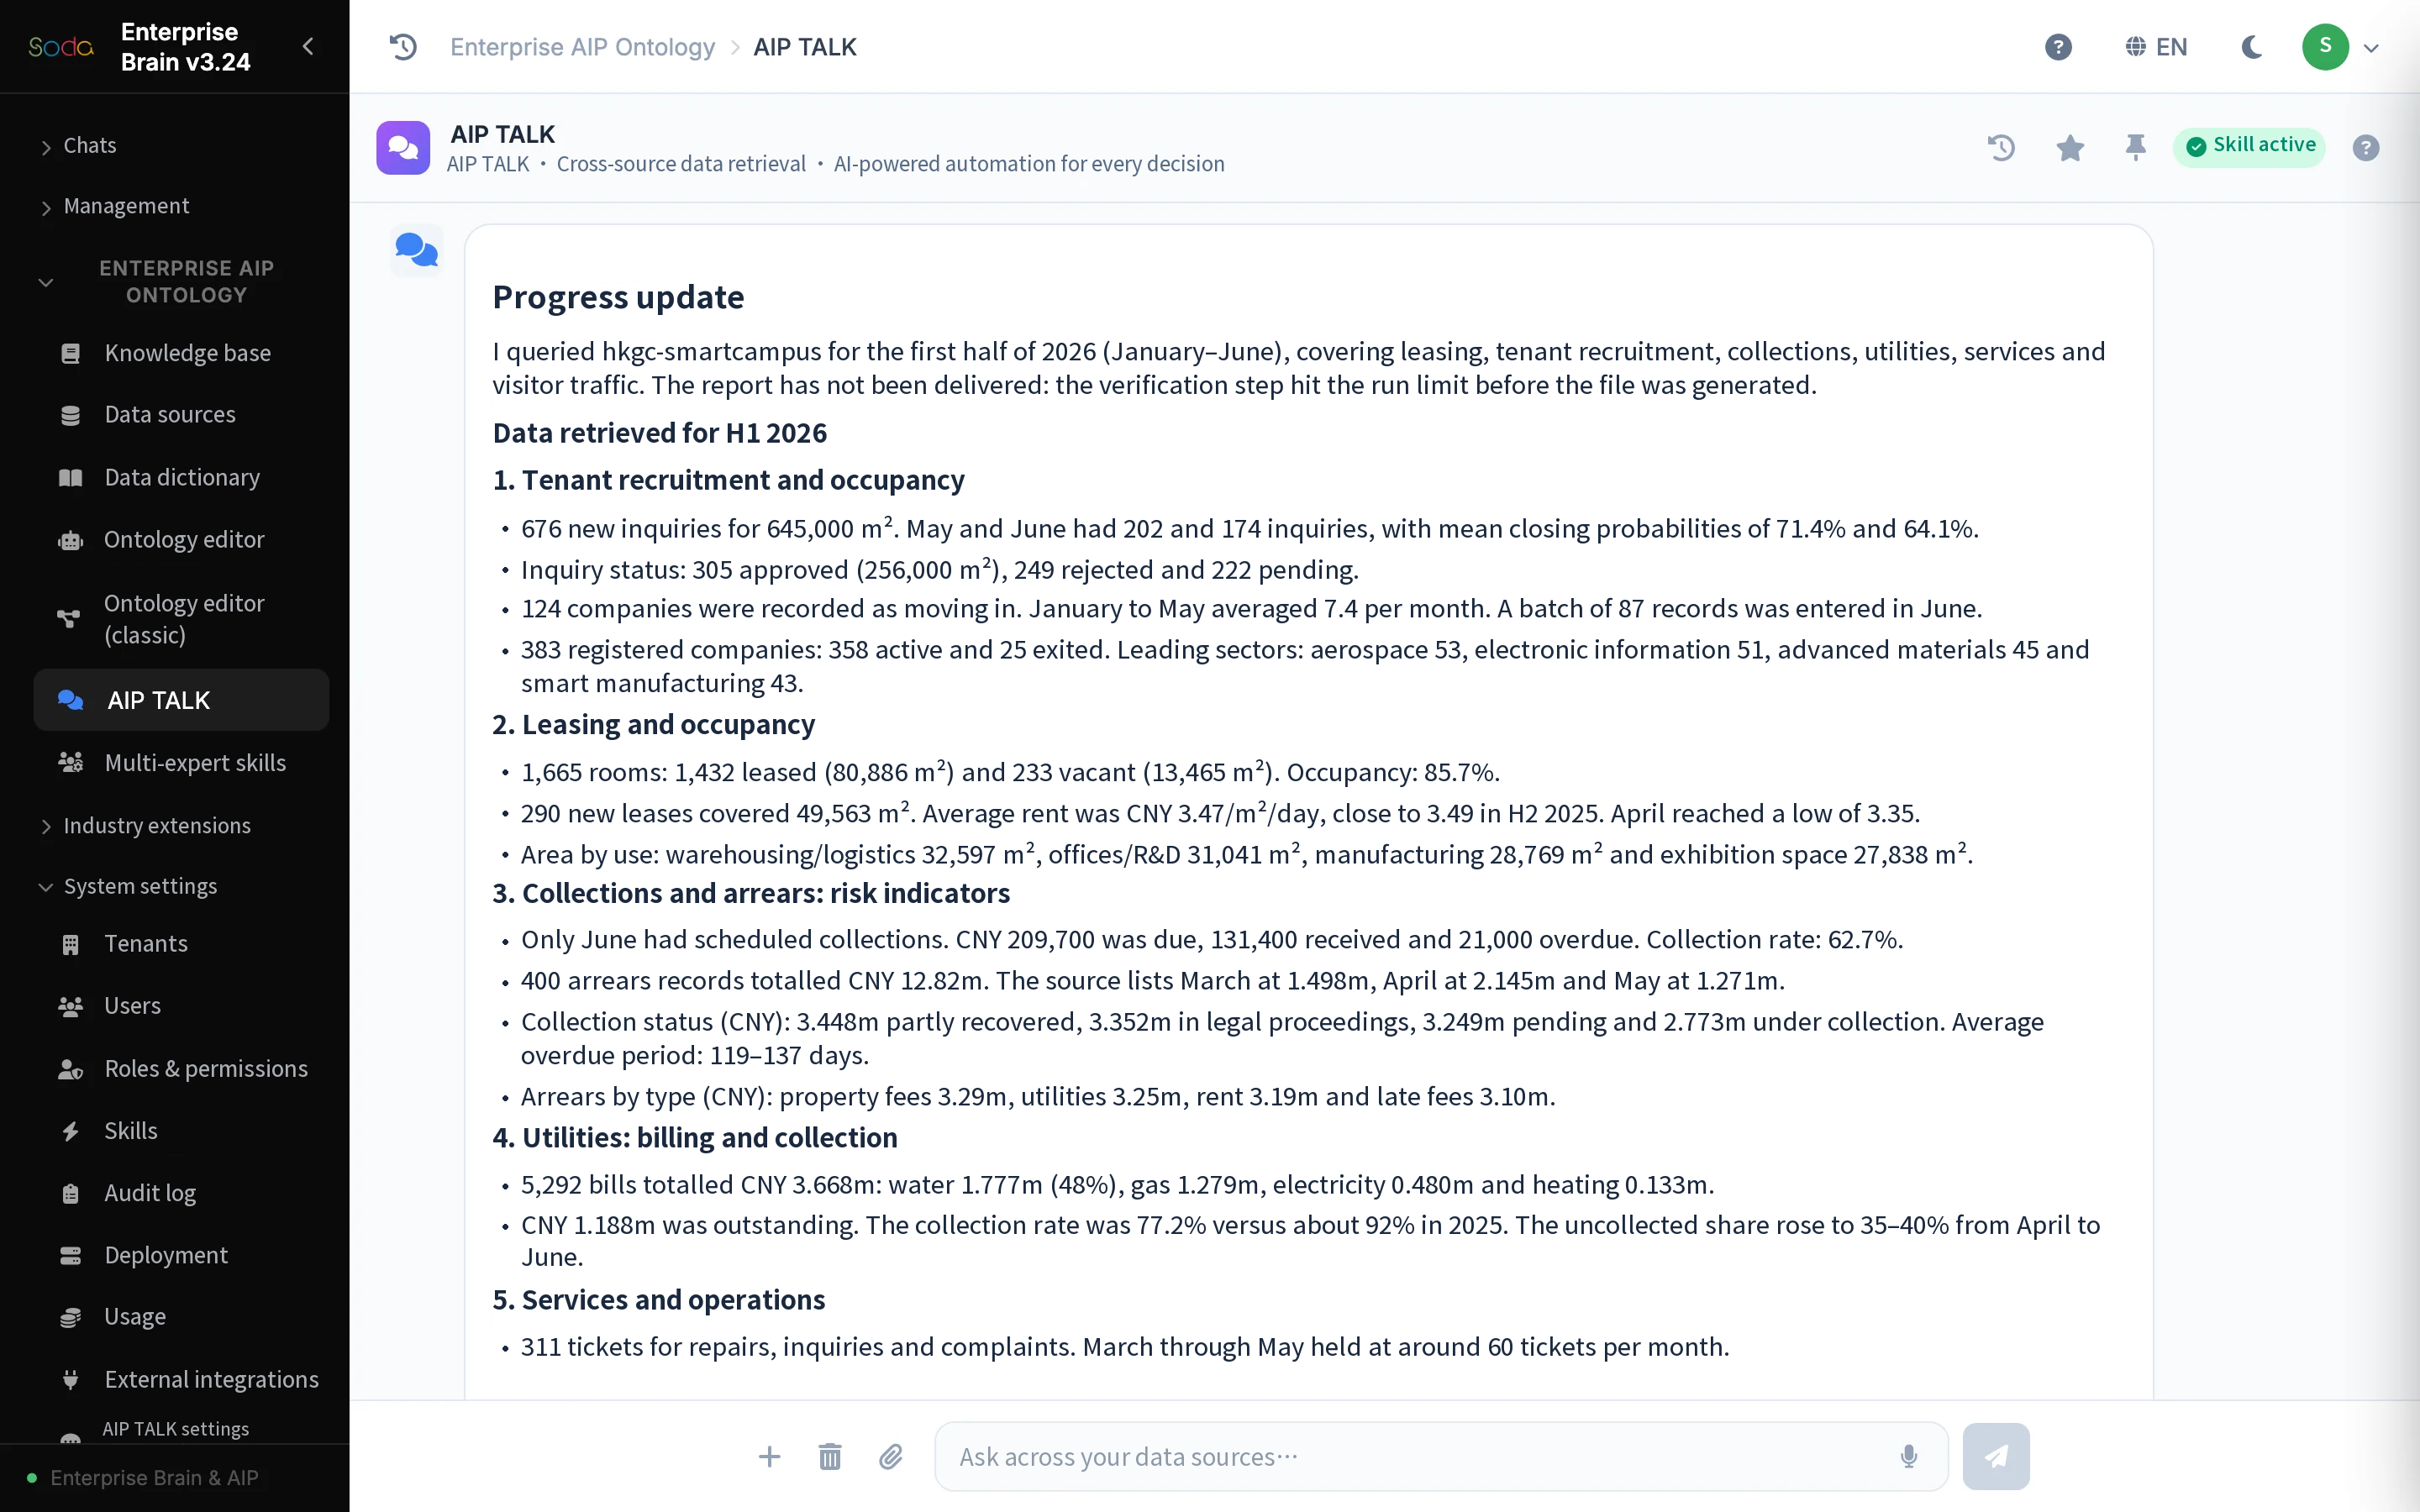
The original case connects to the hkgc-smartcampus operations database, described in the public source as 173 tables and 4.2 million rows. The first request asks for the Aviation Innovation Center’s H1 2026 report. A series of queries covers tenant recruitment, leasing, collections, energy use and work-order service, supplemented by operational information such as visitor traffic.
The recorded progress report lists 383 registered companies, an occupancy rate of 85.7% and CNY 12.82 million in recorded arrears, alongside energy costs and work-order counts. From there, the operations lead can move from an overall view to specific buildings, service categories and recruitment channels that need attention.
“Which buildings have the highest vacancy, and for how long?” Look at individual floors
The product breaks vacancy down by building. Vacant rooms account for 31.7% in Production Workshop E, 28.0% in Laboratory Building C and 27.4% in Services Building D. R&D Office Buildings A and B were fully occupied in this query. A closer look finds 54.8% vacancy on the fourth floor of Laboratory Building C and contiguous blocks of empty rooms across several floors.
The answer suggests that incomplete leasing of whole floors may help explain the pattern. It also identifies a limit on vacancy duration. No room-level vacancy start dates were available, so the calculation uses the expiry dates of contracts that ended without renewal. The approximately 377 days reported for Production Workshop E is an estimate under that method, not a complete room-by-room vacancy history.
“How does property service compare across buildings?” Read closure rates alongside satisfaction
The next follow-up examines work-order response and service satisfaction. The recording compares cumulative work orders across five buildings, including closed, pending and in-progress counts. Cumulative closure rates range from about 47.9% to 52.0%, with roughly 50% across the park. The small differences between buildings direct attention to a shared process backlog.
The analysis then looks at work-order ratings, the proportion of low scores and the difference between proactive tenant assistance and reactive ticket handling. Managers can investigate which orders have stalled and where a handoff needs attention. Cumulative performance and new work orders in H1 2026 appear separately so readers can distinguish their reporting periods.
Where did the 800 prospective tenants come from?
The operations lead wanted to understand where prospective tenants came from. Of the 800 prospects, 400 came from Guangdong (50%), including 257 from Shenzhen. Chengdu, where the park is located, accounted for 100 (12.5%).
The team compared signed leases, lost prospects and registered capital to assess channel quality. Shenzhen had many leads to qualify and follow up. The mix of prospects in Hangzhou warranted further analysis, while local visits and park events could help reach more prospects in Chengdu. Future channel spending also depends on how many leads go on to sign.
When collections fall, check the payment schedule and actual collection rate
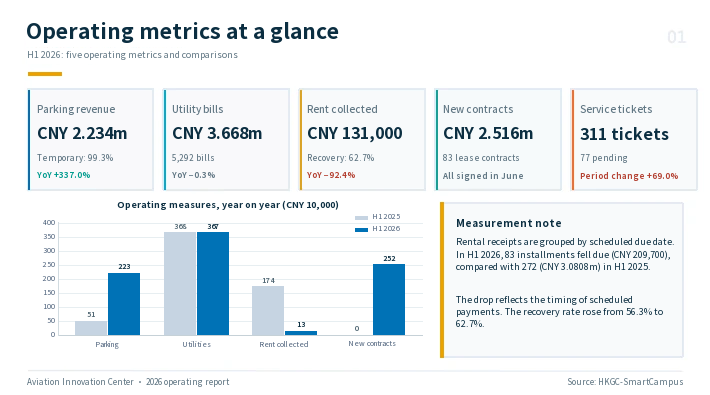
The original site flags a 92.4% year-on-year drop in rent collections as a high-priority risk. It proposes checking payment schedules, addressing arrears and reviewing service performance. A sample report page adds context. Rent collected in H1 2026 was approximately CNY 131,000, and the report groups rent by scheduled payment due date.
The same sample attributes much of the decline in the amount collected to fewer payments falling due. The actual collection rate rose from 56.3% to 62.7%. The first check is therefore which payments were due and which receivables were in scope. The amount alone cannot establish that collection performance deteriorated. Pairing the signal with its definition helps the team prioritize arrears, service and leasing work.
“Export the operating report to PowerPoint.” Track what was actually delivered
The final request asks for a PowerPoint presentation. The recording shows preparation of 10 charts covering vacancy rates and duration, work-order closure and ratings, and prospect origins and conversion. At that stage, 4 report parts had been generated and had yet to be combined for delivery. Public samples of the cover and core metrics page show how the report was organized.
The case documents both analysis and file generation. Progress on individual parts, a sample cover and a finished presentation represent different delivery states. The page reflects the material available for review. To explore additional operational, leasing and service questions, the extended smart park demo uses a separate dataset explicitly identified as synthetic.